Research Article > DOI
Berk Karakus  , Andrea Lisjak , Omid Mahabadi , Christian Viau , Bora Pulatsu
2026 | Volume 1 | e002
Received: 31 January 2026 | Revised: 18 March 2026; 26 March 2026 | Accepted: 10 April 2026 | Published: 27 April 2026
Abstract
Unreinforced dry-joint stone masonry walls (DJ-SMWs) are the load-bearing elements in historic structures and buildings that are well known for their seismic vulnerabilities. In this study, the Finite-Discrete Element Method (FDEM) is used to computationally investigate the in-plane lateral behaviour of DJ-SMWs under varying pre-compression loads. The adopted modelling strategy enables the simulation of cracking within stone units and captures the frictional mechanism along the contact planes between adjacent blocks. Once the proposed framework is validated, it is demonstrated that increasing vertical load enhances the lateral load carrying capacity while reducing ultimate displacement, accompanied by excessive damage in masonry units. The failure mechanisms, which transition from rocking failure under low axial compression to mixed-mode diagonal cracking at higher axial loads, are effectively captured using FDEM for the analyzed DJ-SMW aspect ratio. The proposed framework also provides detailed fracture response of DJ-SMWs, offering better predictive capability compared to conventional modelling approaches. Finally, Equivalent Energy Elastic-Plastic bilinear curves and ductility index analyses are used to quantify the deformation and failure mechanisms. The results contribute to a deeper understanding of DJ-SMW behaviour, facilitating the development of conservation and strengthening strategies for heritage masonry structures.
Keywords
unreinforced masonry, dry-joint stone masonry, Finite-Discrete Element Method, structural analysis, ductility index
How to Cite: Karakus B, Lisjak A, Mahabadi O, Viau C, Pulatsu B. Investigation of the In-Plane Behaviour of Dry-Joint Stone Masonry Walls Using the Finite-Discrete Element Method. Resilience and Reuse in the Built Environment. 2026; 1:e002.
Download .RIS Download .BibTeX
Link: doi
Introduction
General
Unreinforced masonry (URM) is a construction technique dating back thousands of years and constitutes a significant portion of the existing residential building stock and overall cultural heritage worldwide. Traditionally, URM structures are constructed using locally available materials, including masonry units (e.g., stone blocks, clay bricks) and a binding agent (i.e., mortar). URM structures can also be built without a cohesive binding agent to bond the masonry units, a technique known as dry-joint masonry. It is worth noting that even in cases where a binding material is initially present, prolonged exposure to various environmental factors (e.g., freeze-thaw cycles and extreme temperature fluctuations), and inadequate or preventive maintenance can lead to significant degradation of the mortar joints and the bond itself. This phenomenon often results in the complete/partial loss of mortar joints or, at the very least, the weakening of the bond between the mortar and the masonry units over the structure’s lifespan, effectively transforming it into a dry-joint system [1-2].
Unreinforced stone masonry walls are the primary load-bearing structural elements in most historic masonry buildings and structures, which can be constructed using either neatly cut (i.e. regular) or irregular stone blocks. In the absence of mortar joints, the mechanical interaction between adjacent masonry units relies on the frictional resistance between them, and the structural integrity is primarily governed by the construction quality of the stone masonry walls [3]. During the post-earthquake observations and reconnaissance visits [4-5], URM structures are at a high risk of severe damage or partial/total collapse due to the vulnerability caused by the low-bond strength in between structural elements [5]. Typically, if out-of-plane mechanisms are prevented by implementing steel ties or appropriate floor slab-wall connections that ensure the box behaviour, the likelihood of in-plane mechanisms occurring during a seismic event increases [6].
The discrete-element method (DEM) is widely used to model masonry structures as these structures are built through discrete units (or blocks) and form discontinuous medium. Unlike continuum-based approaches, such as the conventional finite-element method (FEM), DEM allows the masonry as a group of discrete units interacting along their boundaries. This approach makes DEM particularly suitable for simulating contact behaviour, opening and closure of joints, sliding, separation, and progressive crack development [7].
To this end, the present research undertakes a computational investigation, focusing on the structural assessment of unreinforced dry-joint stone masonry walls (DJ-SMWs) subjected to combined in-plane compression-shear loading using the finite-discrete element method. The adopted computational approach is validated comparing against the experimental study conducted by Lourenço et al. [8]. The proposed numeric approach falls into the category of discontinuum-based analysis following the simplified micro-modelling (SMM) approach [9-11].
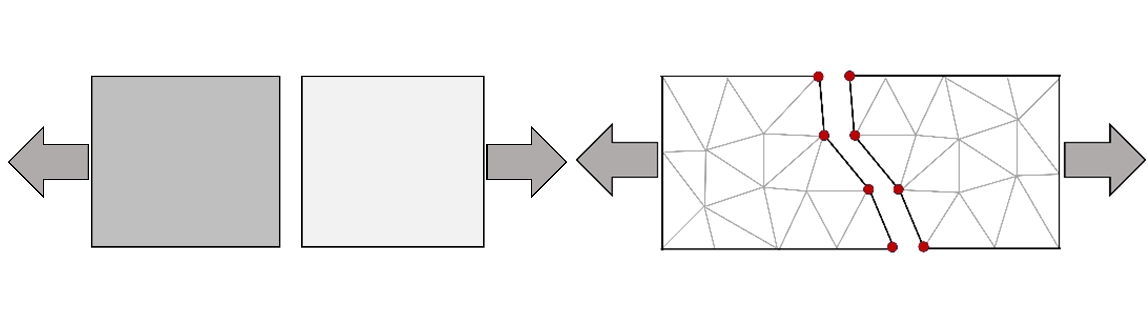
The adopted two-dimensional computational procedure uses the finite-discrete element method (FDEM) developed by Munjiza [12]. This method, which borrows from both DEM and FEM, explicitly represents masonry units as individual blocks, which are themselves meshed internally into distinct elastic triangles. Unlike conventional SMM, whereby two discrete blocks replicate the masonry units with a potential crack surface [13], as shown in Figure 1 (a), the adopted modelling strategy imposes considerably less restriction on crack nucleation and propagation within the masonry units by using an unstructured triangular block medium, as shown in Figure 1 (b). Furthermore, the failure between blocks, such as separation and sliding, can be captured through the assigned contact constitutive laws defined between adjacent blocks. The proposed computational modelling framework aims to capture the underlying fracture mechanism within stone masonry units when DJ-SMWs are subjected to elevated vertical pressure combined with lateral in-plane loading. The results of the adopted modelling strategy allow for a better understanding of potential localized failure mechanisms in stone units compared to conventional SMM strategy.
The study aims to develop and validate a FDEM based numerical model that can be used in the prediction of DJ-SMWs subjected to combined in-plane pre-compression and lateral shear loading. The proposed numerical modeling framework accounts for both inter and intra-block failure mechanisms. The contact constitutive laws defined in between adjacent masonry units enable simulations to capture the dominant inter-block failure modes, such as opening or sliding, whereas discontinuous masonry units (represented via a group distinct triangular blocks) may have failure under the prescribed two-dimensional stress-state. By combining these two features, the framework provides a suitable, computationally-efficient, and robust tool for the numerical analysis of DJ-SMWs.
The manuscript is organized as follows. First, the computational procedure of FDEM is briefly explained. Then, a discussion of the decision-making process for determining number of discrete elastic block per masonry unit is presented and the model verification is provided. Subsequently, Equivalent Energy Elastic-Plastic (EEEP) curves and ductility parameters of the considered walls are analyzed to highlight their significance.
A Brief Overview of Finite-Discrete Element Method (FDEM)
The adopted two-dimensional combined Finite-Discrete Element Method (FDEM) provides an explicit representation of the fracture process within a discontinuous medium, discretized into a group of discrete elastic constant-strain triangular finite elements. As fracturing occurs, the initially bonded discrete elements undergo separation and full detachment from their neighbouring elements [14]. In the FDEM framework, discrete triangle elements interact with each other through pre-defined contact mechanisms and relationships. During the analysis, fracturing and fragmentation occur at the interfaces between the triangular elements (also denoted blocks in this study), which mechanically interact in both normal and shear directions [15]. The earlier implementations of the FDEM (e.g., [15]) employed a structured discretization pattern that may induce regular/straight crack paths and neglect the inherent complex fracture mechanism in masonry structures. Specifically, the numerical procedure of FDEM is based on an explicit solution scheme, where equations of motion are solved simultaneously for nodal velocities at each degree of freedom of the triangular elements [16]. Once obtained, velocities (ū) can be integrated to obtain nodal displacements (u), as shown in Equation 1. Quasi-static solutions can be obtained using artificial damping formulations unless dynamic analysis or high loading-rate problems are investigated.
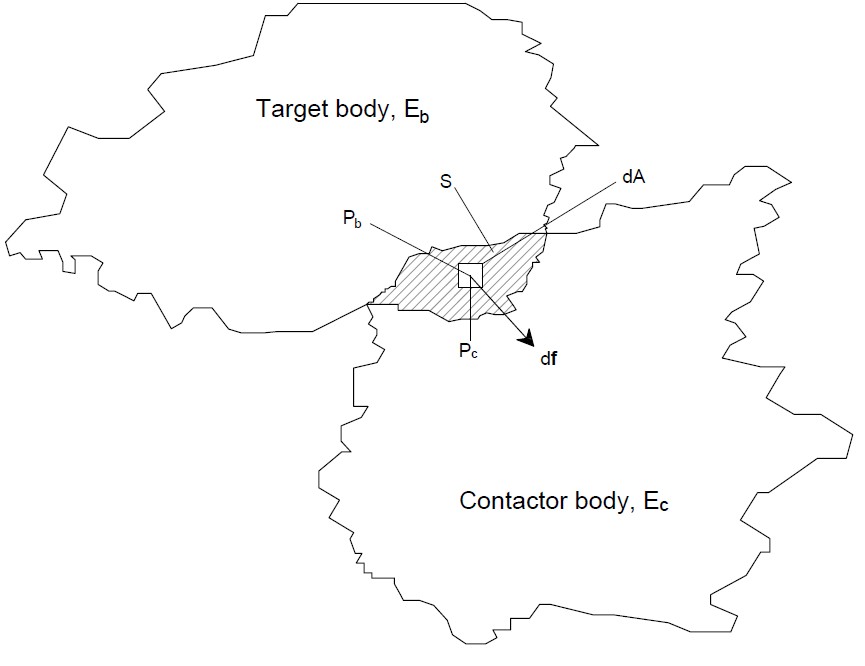
Once the initial contacts between adjacent triangular elements are identified, the contact stresses are computed during analysis using the “no binary search” contact detection algorithm. Interaction forces are then calculated for overlapping elements using a distributed contact force penalty function method [17]. The infinitesimal repulsive forces, defined as contact forces called (df), are calculated using a distributed contact force penalty function method on the infinitesimal overlapping area (dA), as shown in Equations 2 and 3 [18]. Those forces are calculated by considering the difference between the gradients of the potential functions of the elements φc and φb at the points Pb and Pc. A visual representation of these terms is shown in Figure 2.


As per Tatone and Grasselli [19], the difference in the gradients of the potential functions over the total overlapping area S on the body Ec is integrated to calculate the total repulsive interaction force fc:

Frictional forces (Fr), represented in Figure 3, are calculated using a Coulomb-type friction law, defined using:

where h is the element edge length; pt is the tangential penalty coefficient; σn is the normal stress across the interacting edges, and fr the user-defined friction coefficient (fr = tan Φ, where Φ is the friction angle). The correct sign of σtang is determined by the direction of the sliding, in this case sliding distance, δs.
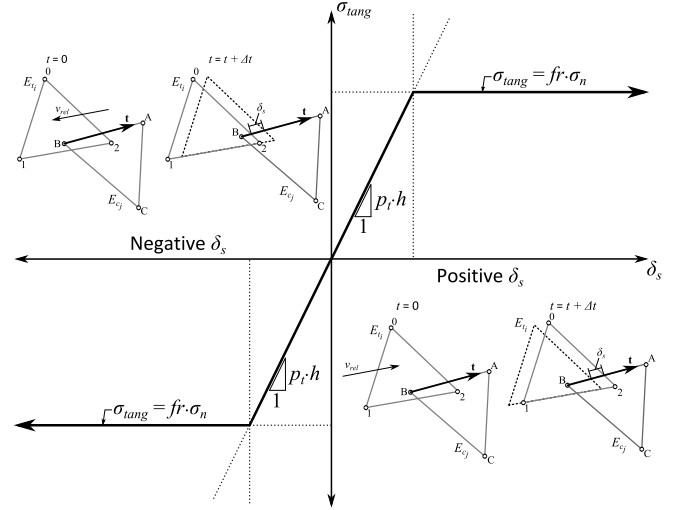
The tangential stresses are applied as reactionary forces at the nodes that form the interacting edge of Ecj, parallel to t, and as equivalent nodal forces distributed among the nodes that form the interacting edge of Eti, just as the repulsive interaction forces.
Once δs is such a value that |fr · σn| < pt· h·|δs|, the value δs is updated using:
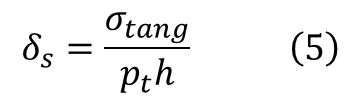
Whereby σtang is given by the value of fr · σn for all ensuing time steps. Fracture initiation and propagation are simulated using nonlinear fracture mechanics. The shear strength (τ), of the elements is therefore calculated by the Coulomb-Terzaghi equation with the use of cohesion, c:

Cohesive crack elements are inserted along the edges of triangular finite elements. They may yield and break under Mode I, Mode II, or mixed-Mode I-II conditions.

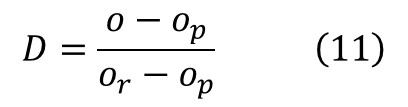
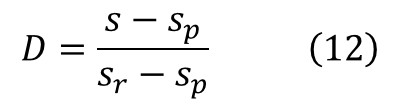
where o is the opening, op is the peak opening, and or is the residual opening, in meters. Similarly, s is the slip, sp is the peak slip, and sr is the residual slip, in meters. The softening law of the stresses acting at the crack elements is governed by the function of damage coefficient, D, and with the use of tensile strength, ft, and shear strength, fs:
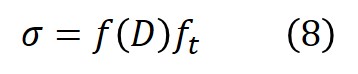
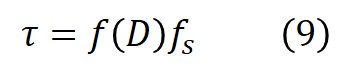

where a, b, and c are empirical curve fitting parameters with values of 0.63, 1.8, and 6.0, respectively, and D is a damage coefficient with a value between 0 and 1.
Mode I:
Mode II:
Mode I-II:
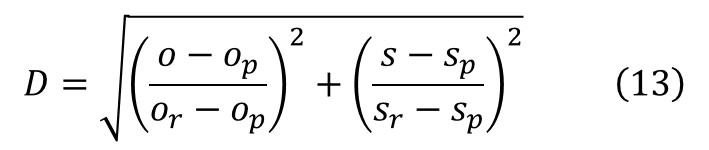
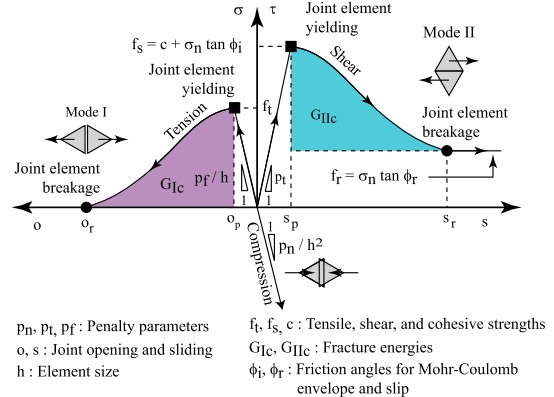
A graphical illustration of the softening behaviours is shown in Figure 4. The interface behaves elastically up to the tensile (ft) and shear strength (fs) limits. After reaching those limits, the tensile and shear responses progressively soften according to the Mode I (GIc) and Mode II (GIIc) fracture energies. At the final stage of degradation, the tensile strength goes to zero, and shear strength becomes equal to the residual capacity (fr) contributed by the Mohr-Coulomb law. On the other hand, since there is no defined compression failure criterion, compressive behaviour is completely linear with the slope of assigned penalty parameter (pn).
Methods
Parametric Analysis on the Masonry unit discritization
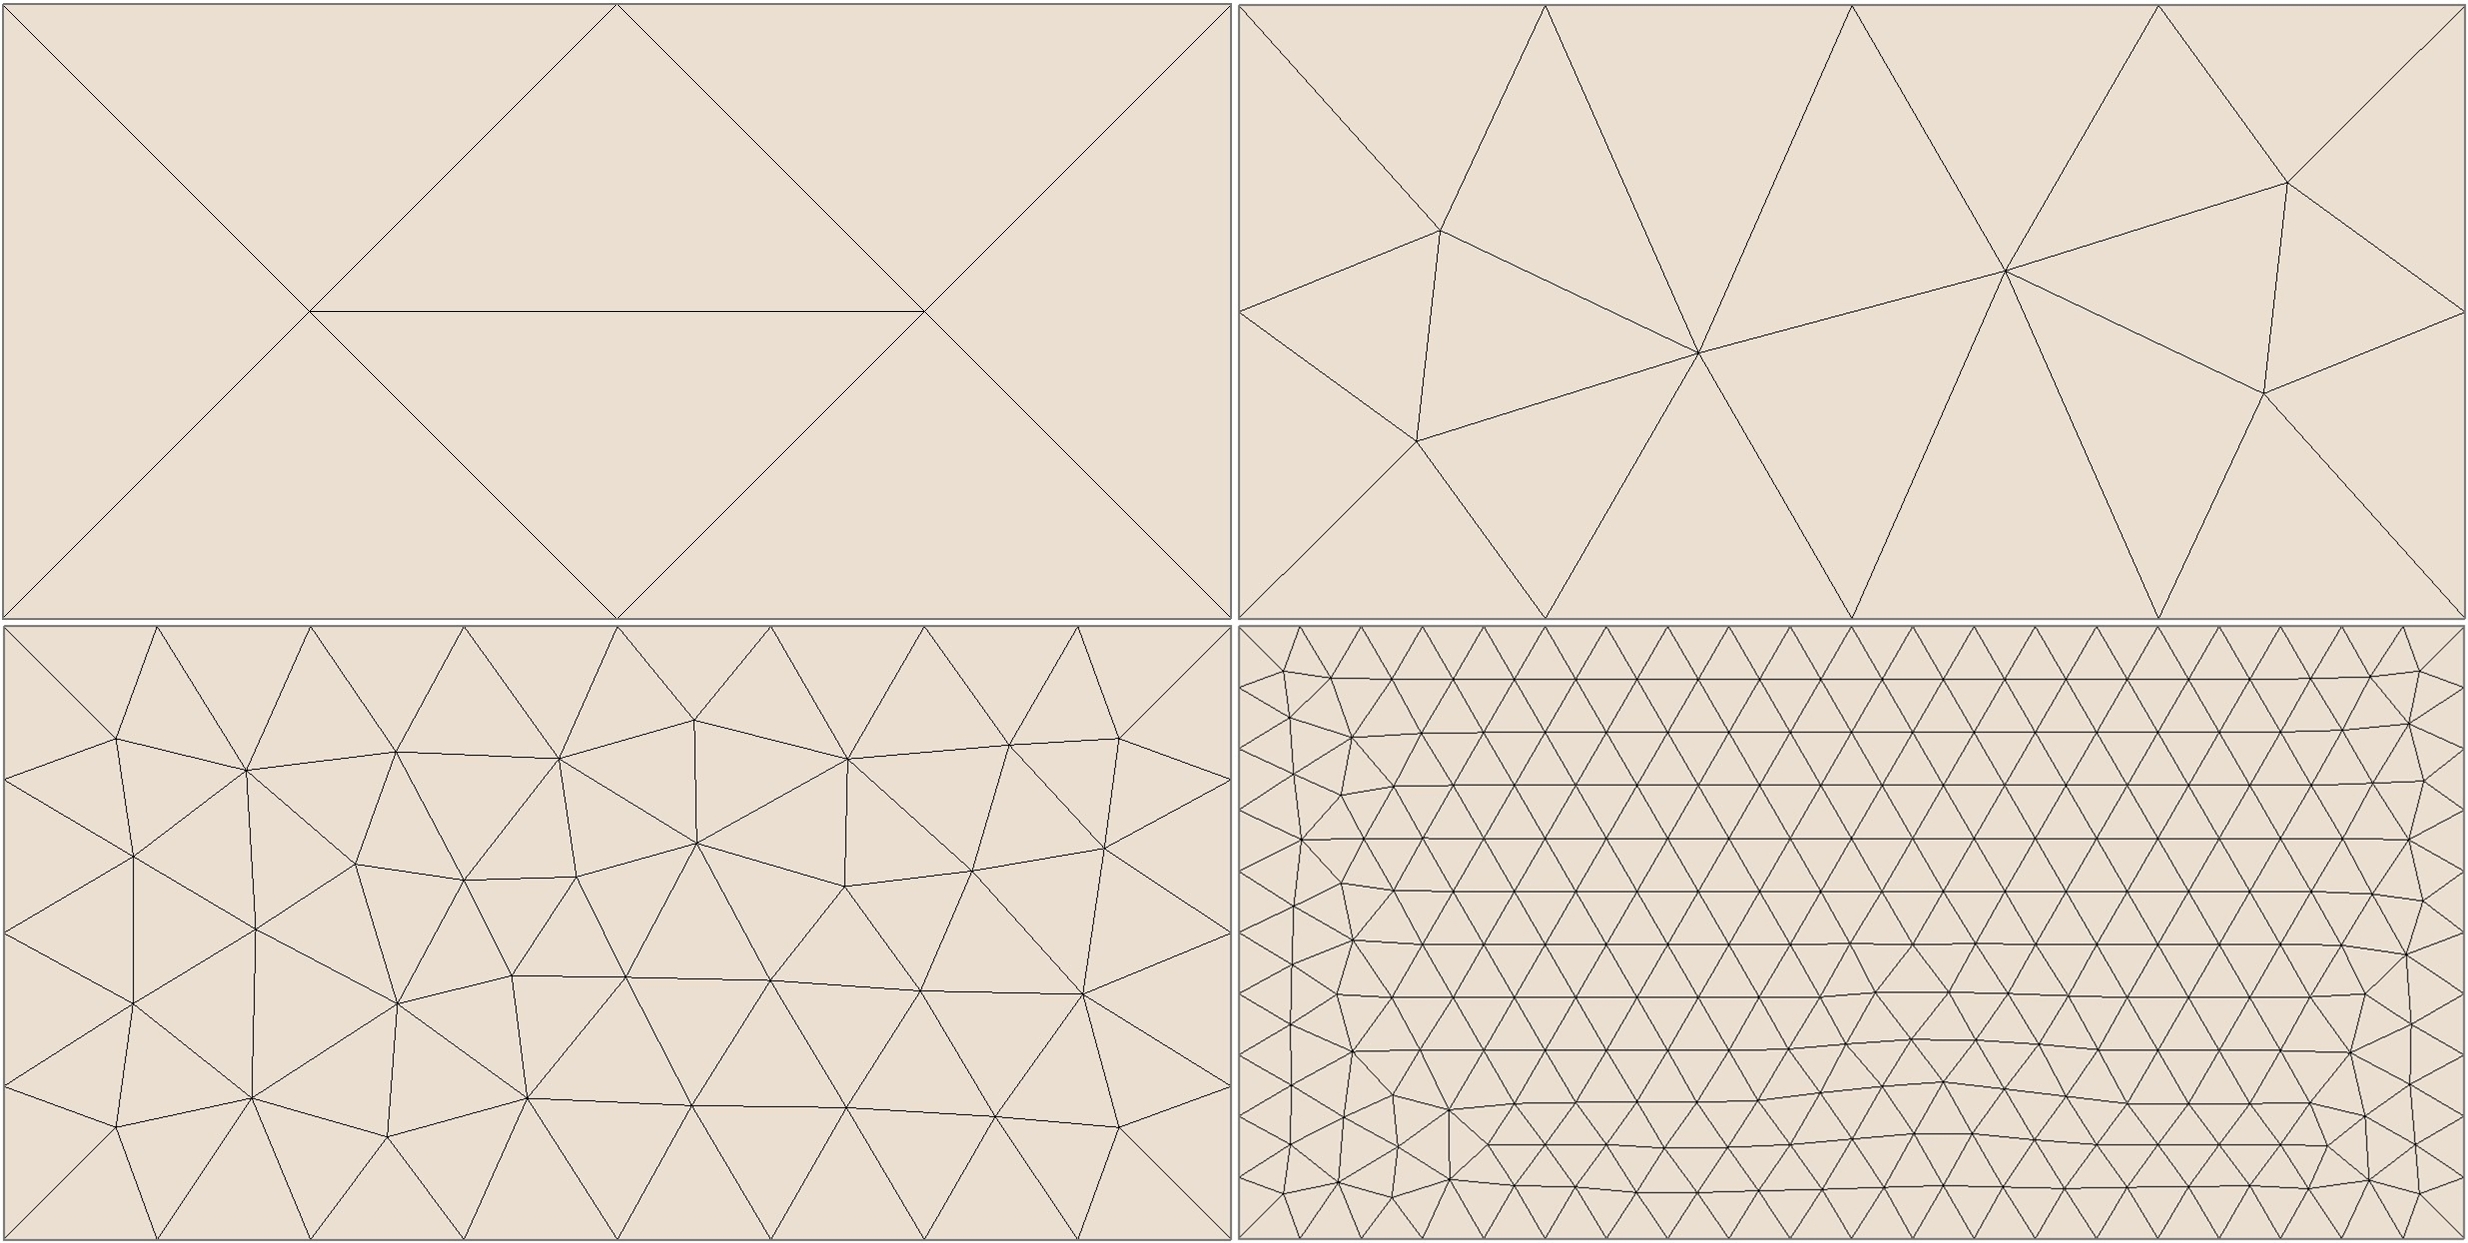
The number of discrete elastic blocks used in discontinuum-based simulations plays an important role in the obtained fracture resolution and accuracy of the computational model [21-22]. For this reason, it is necessary to determine an appropriate block size, often quantified as the number of discrete deformable blocks. In order to generate a consistent and geometrically compatible mesh within the block domain, the FDEM analysis software, Irazu [18], uses an open-source mesh generator Gmsh [23]. The desired mesh sizes have been set as the element edge length and each triangular element in the mesh corresponds a discrete elastic triangular block in the simulation. According to the sensitivity analyses, consisting of a series of analyses on the tensile behaviour of a single stone block (see Figure 5), the appropriate number of elastic blocks defined within the domain is determined. In these analyses, one end was fixed and the other end was subjected to a tensile force. It is worth noting that reducing mesh sizes, while providing higher resolution and an accurate representation of the problem domain, requires considerably more computational power. Mesh sizes of 100, 50, 25, and 10 mm, corresponding to 1, 2, 4, and 10 elastic blocks per edge scenarios, respectively, were investigated. Each mesh size and its visualization are given in Figure 5, for 1, 2, 4, and 10 blocks per edge as Figure 5 (a), Figure 5 (b), Figure 5 (c), and Figure 5 (d), respectively.
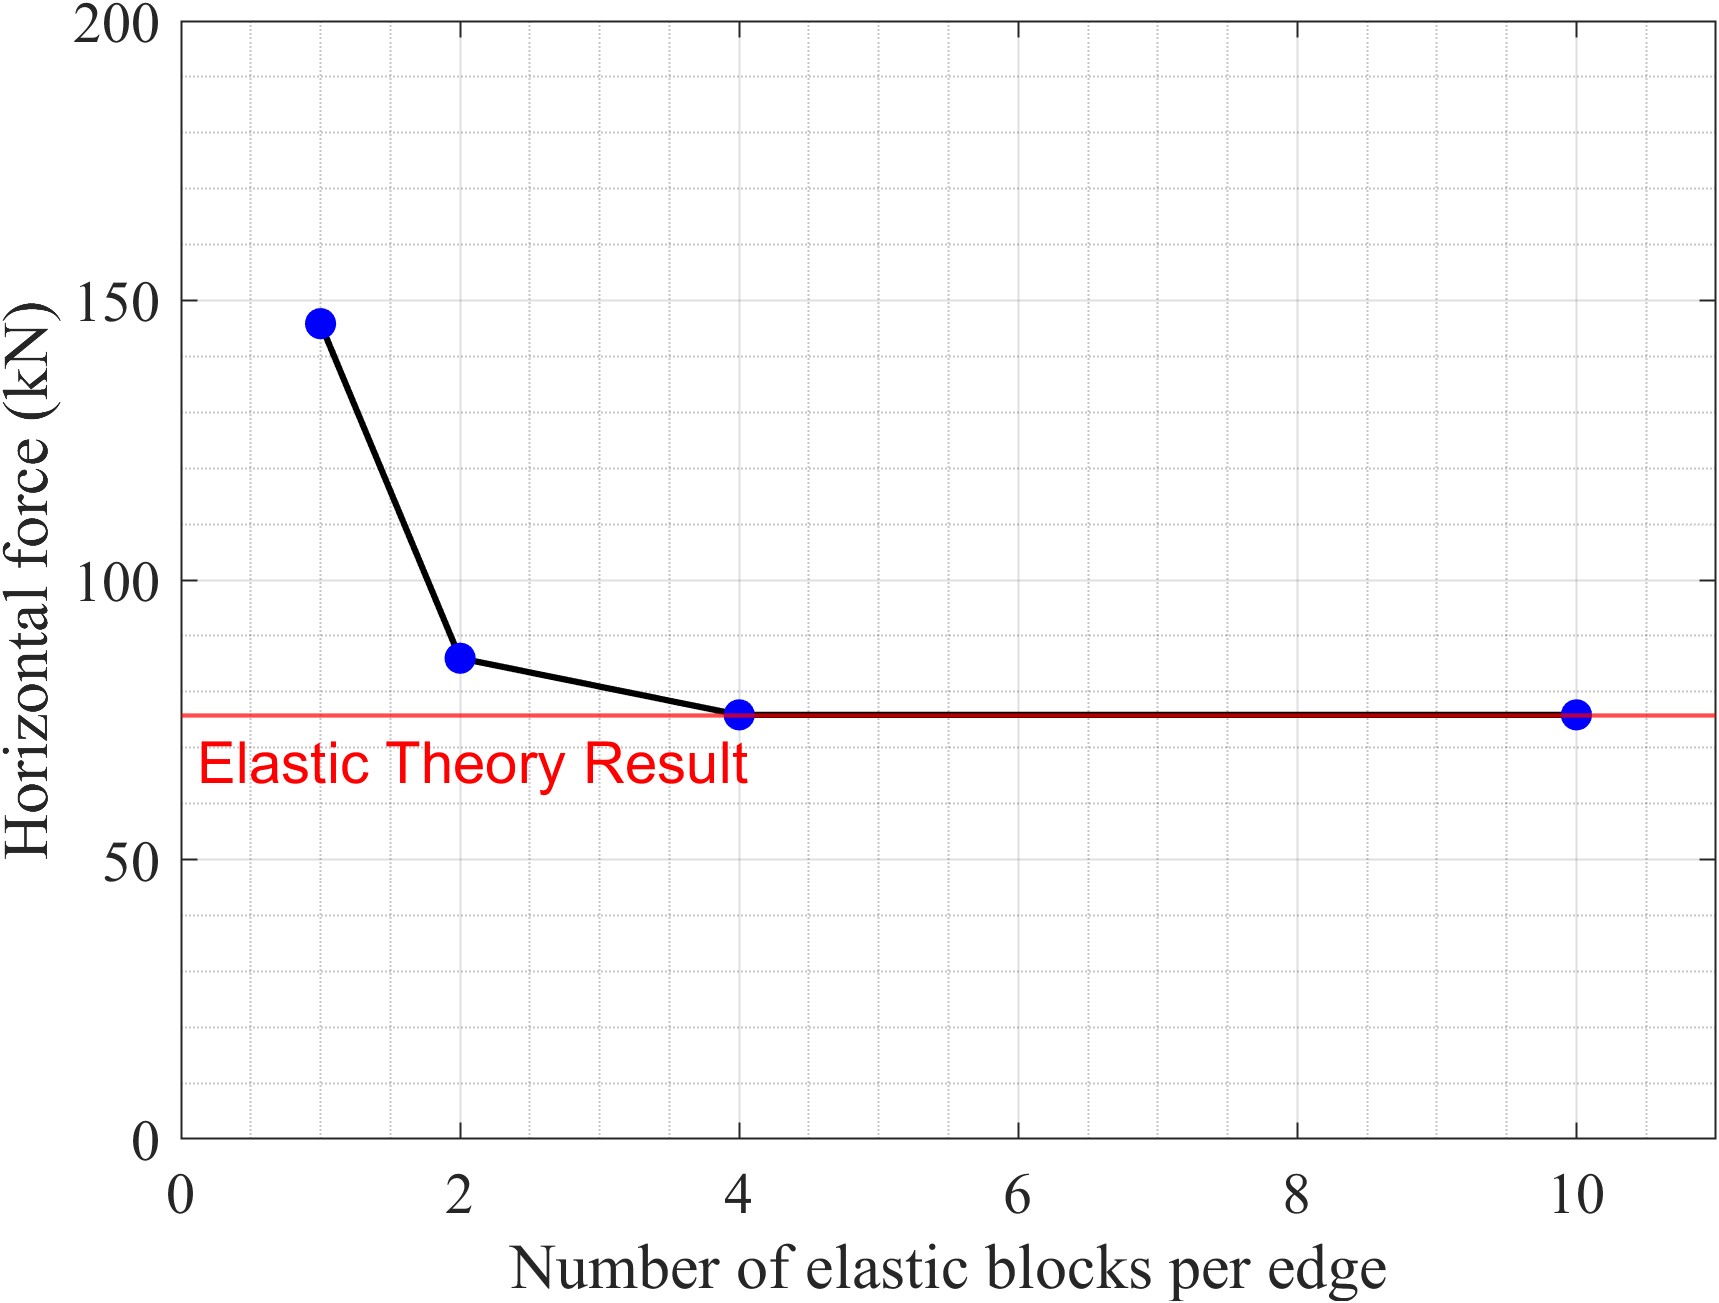
The results of the mesh sensitivity analysis are presented in Figure 6, where convergence occurred at a mesh size of 25 mm (corresponding to four blocks along the short axis of the masonry unit). The use of more than four triangular elements along the short axis of the cross-section does not improve the accuracy significantly and would only increase the computational cost without any additional benefit. This convergence indicates that the numerical solution has reached a stable state, effectively minimizing the influence of mesh size on the fracture energy. Thus, a mesh size of 25 mm was used in the future investigation of the horizontal loading response of the dry-joint masonry wall.
Modelling Approach and Inputs
In this section, an experimental investigation of dry-joint masonry walls conducted by Lourenço et al. [8] is used to validate the proposed FDEM-based modelling framework. In the benchmark study, seven dry-joint masonry walls were tested. The wall specimens were constructed from sandstone blocks known as “Montjuic stone”, a commonly used local material in the region of Catalonia. The dry-joint walls were subjected to combined shear-compression loading with pre-compression stresses ranging from 0.15 to 1.25 MPa. During the testing, the prescribed vertical pre-compression stress was first applied, followed by the introduction of lateral in-plane loads. The experimental test setup is shown in Figure 7 (a), from which it can be observed that the bottom-left corner of the wall specimens was secured to prevent premature sliding failure during testing. As shown in Figure 7 (b), a numerical model was created to simulate the experimental setup, whereby the base and bottom-left corner of the simulated wall specimens were pinned to mimic experimental boundary conditions. A reinforced concrete (RC) beam was positioned at the top of each wall specimen and detailed to permit free rotation (i.e., simply supported). In the FDEM computational model, to mimic the same behaviour, the gridpoints of the element located at the left toe and bottom surface were assigned zero displacement. On the other hand, no restraints were applied at the top of the RC beam to emulate the experimental conditions. The assigned vertical loads in the analyses included the self-weight of the wall as well as the reinforced concrete beam, as visualized by a vertical arrow in Figure 7b, and the axial force required to achieve the desired pre-compression stresses. Constant gridpoint velocities were assigned at the top surface of the loading beam to horizontally load the wall, as visualized by a horizontal arrow in Figure 7b, and base shear reaction forces were recorded during the analysis.
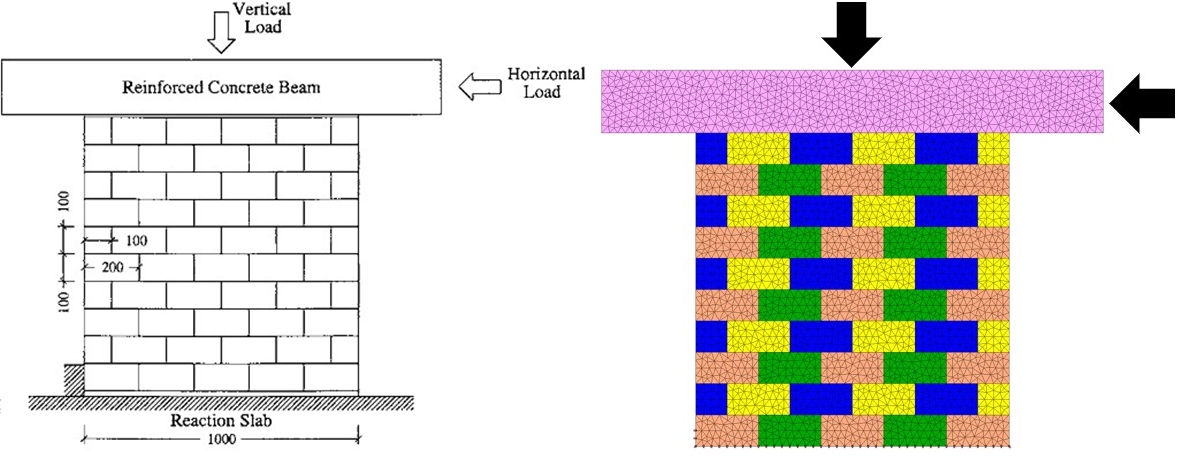
In the experimental study, the behaviour and response of the walls under different pre-compression levels were investigated. The calculated Young’s Modulus values of the walls obtained from the experimental results are reported in Table 1. These Young’s Modulus values were used as inputs for the wall stiffness and as a key parameter in the calculation of the shear modulus.
Table 1. Young’s Modulus values corresponding to pre-compression stresses [8].

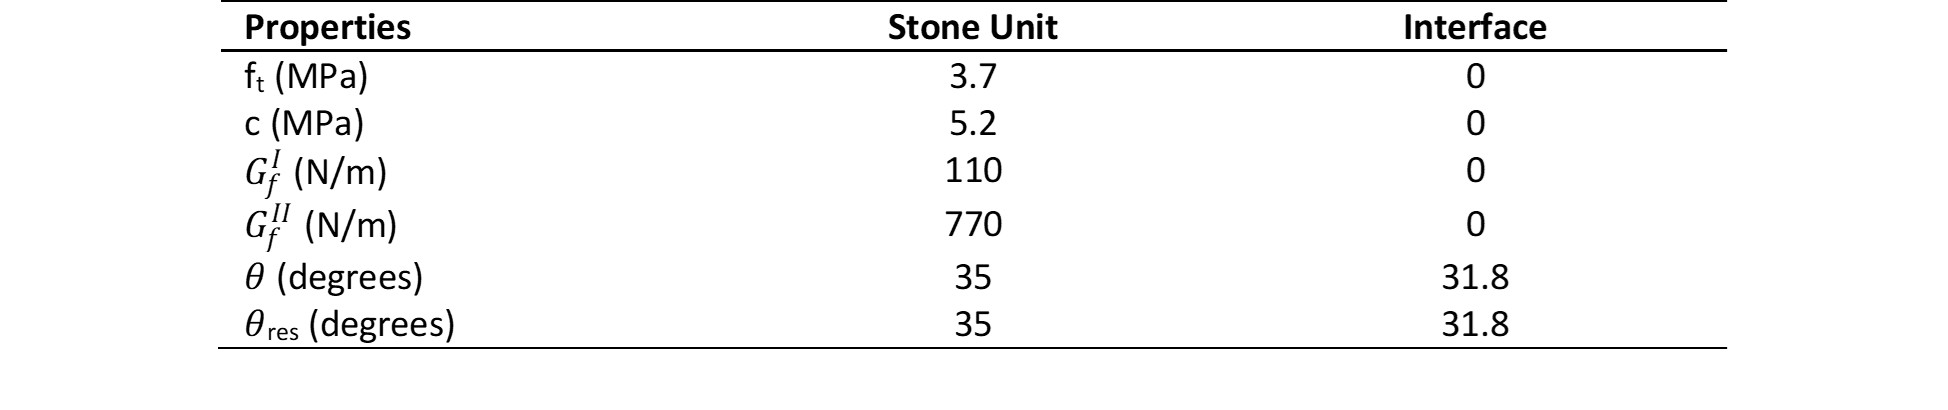
In the FDEM model and as summarized in Table 2, the input parameters were defined based on the available material characterization experimental test results and similar numerical studies published in the literature [8,24,25], since not all required input parameters were available in the validation study. The properties mentioned in Table 2 are tensile strength (ft), cohesion (c), fracture energy mode I (GfI), fracture energy mode II (GfII), friction angle (θ), and residual friction angle (θres), respectively. The tensile strength was adopted from the validation study [8], the friction angle and residual friction angle values were taken from [24], and the estimations of cohesion and fracture energies were done using the recommendations given in Celano et al. [25].
Table 2. Material parameters utilized in the FDEM analyses.
Results
Predicted Force-displacement Relationship via FDEM
Pre-compression loads, namely 30 kN, 100 kN, 200 kN, and 250 kN, were considered in the experimental test programme, corresponding to vertical stresses of 0.15 MPa, 0.50 MPa, 1.00 MPa, and 1.25 MPa, respectively, to simulate various levels of gravity loading typically found in masonry structures. It is important to note that increasing vertical pressure was expected to affect the initial stiffness of the wall specimens due to partial joint closures. The elastic stiffness of the discrete blocks was calibrated using an existing empirical relationship that considers pre-compression loads in line with the experimental findings. As shown in Figure 8 (a), the numerical predictions showed good agreement with the experimental test results in terms of the initial stiffness and general force-displacement trends. In Figure 8 (b), the numerical model captures the experimental response well in both initial ascending region and the peak region. For Figure 8 (c), the simulation manages the capture initial stiffness satisfactorily; however, slightly overestimated the capacity. As shown in Figure 8 (d), the numerical model matched the experimental response very well in both ascending region and the peak region. Overall, the numerical predictions showed good agreement with the experimental results. Both the experimental and numerical studies demonstrated the beneficial effects of increasing the vertical load on the in-plane lateral behaviour of dry-joint masonry walls. In agreement with the experimental findings, the FDEM models accurately captured the lateral load-carrying capacity and predicted comparable pre- and post-peak force displacement behaviour.
Additionally, the findings of this research were compared with other modelling approaches, including discontinuous finite element analysis [8] and the discrete element method [13]. Therefore, the proposed idealization of dry-joint walls within the FDEM framework has provided good predictions and comparable results with respect to the previous studies in the literature [8,13].
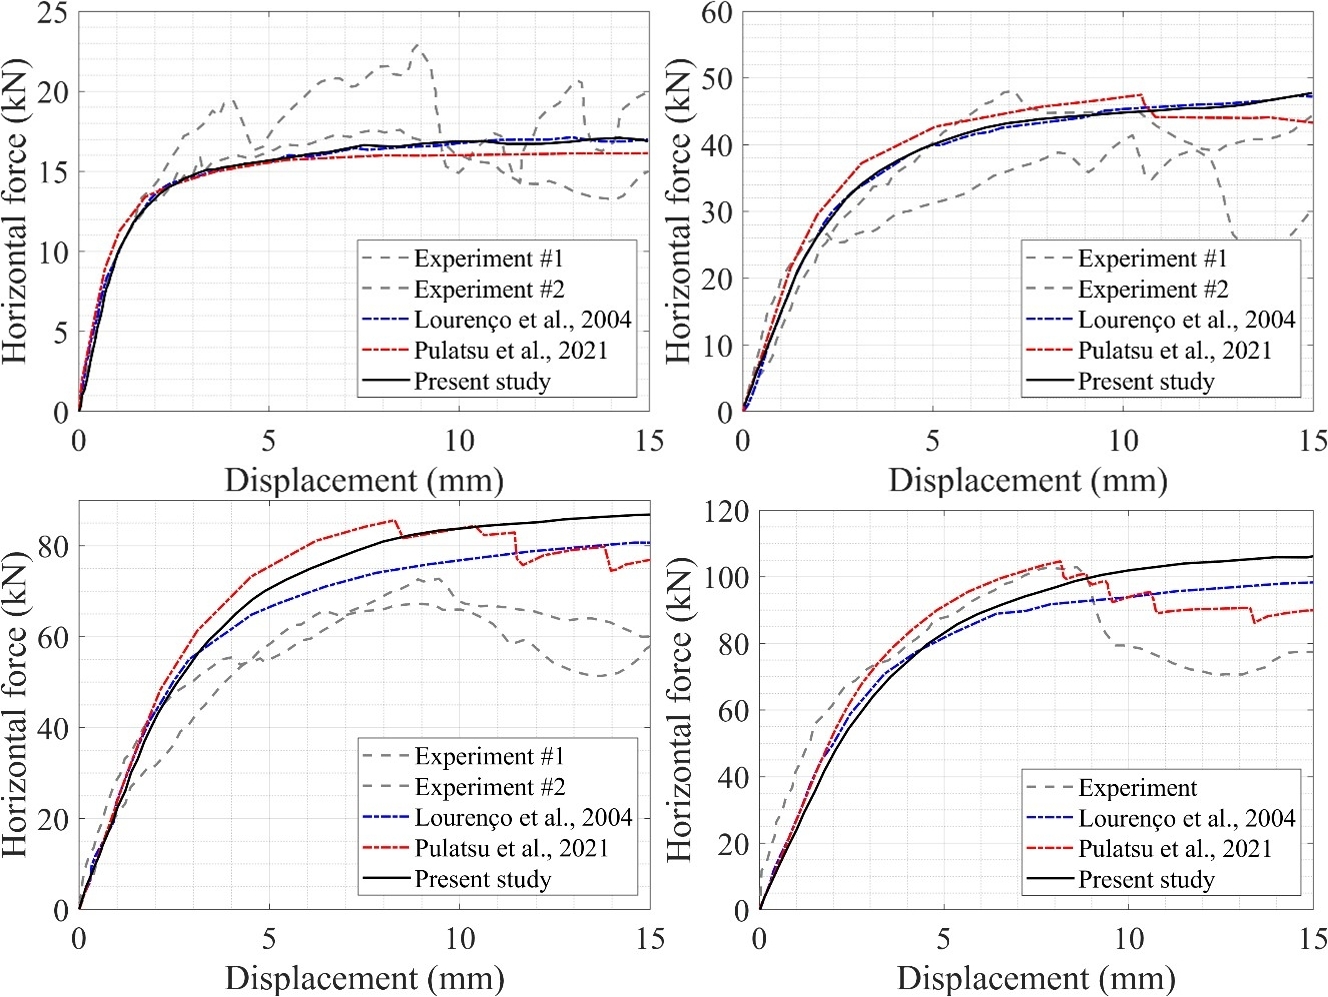
As shown in Table 3, the numerical methods provided generally reasonable predictions of maximum loads when compared with experimental test results. The FDEM results are in agreement with simulations conducted using the other numerical methods, namely, FEM and DEM. The results also confirm that the proposed modelling strategy could capture the overall increase in maximum lateral load with the increase in the vertical pre-compression stress.
Table 3. Recorded maximum load comparison of numerical methods and experiments.

Since the FDEM framework has shown that it could capture the experimental force-displacement behaviour successfully, the validity of the predicted collapse mechanisms observed in the simulations will be discussed in the following section.
Collapse Mechanism
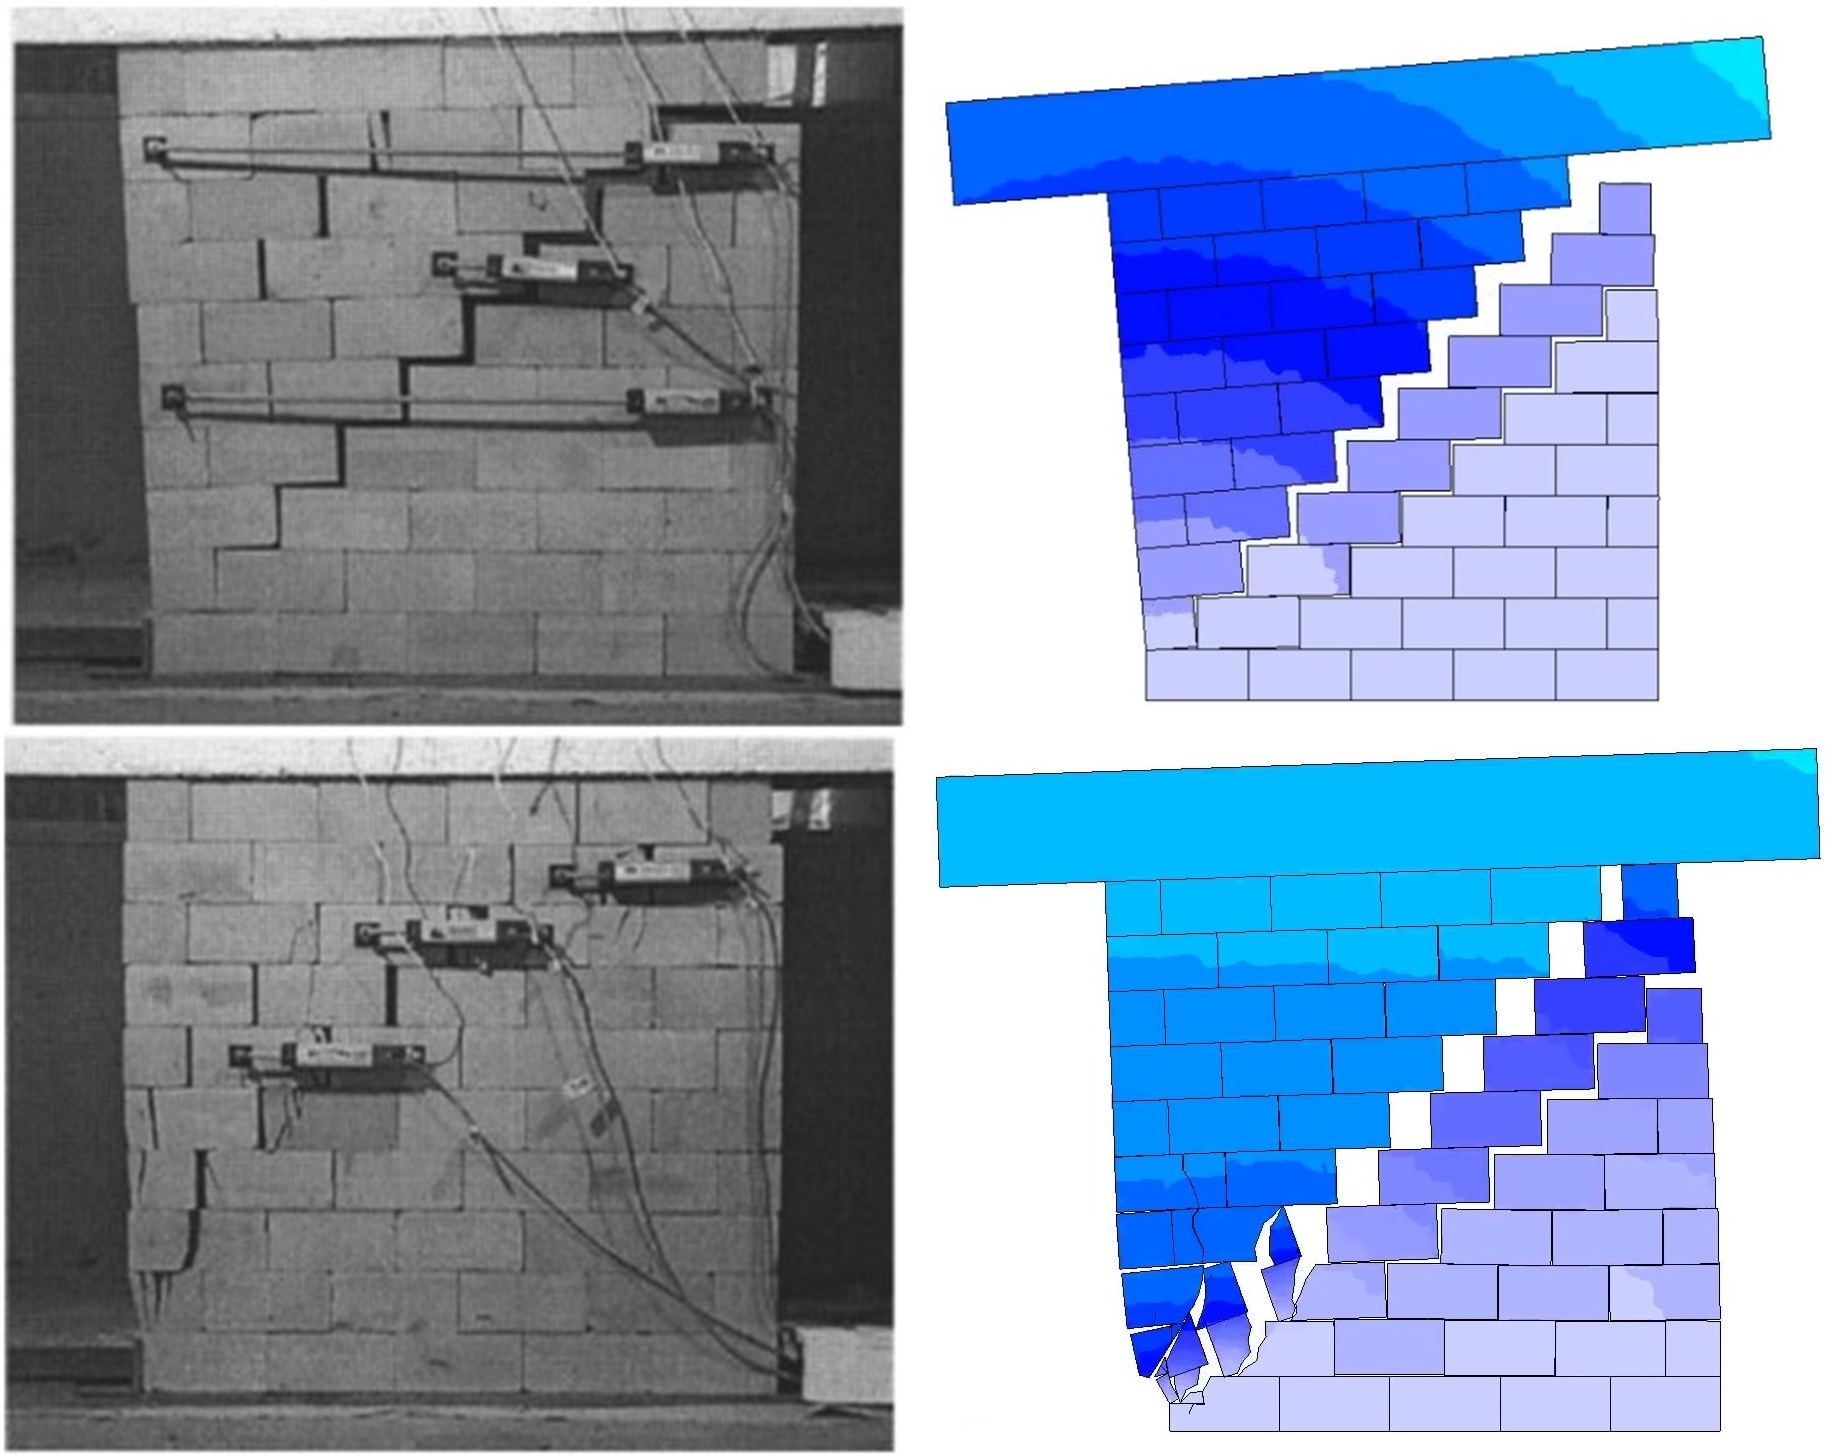
The structural response of the tested dry-joint masonry walls subjected to in-plane lateral loading can be classified according to the observed dominant failure modes. These failure modes vary depending on the applied vertical load level. The two main dominant observed failure modes were: (i) Rocking, which is characterized by a full rigid-body rotation and stair-step joint opening type of failure at low compression levels, as shown in Figure 9 (a) and Figure 9 (b); and (ii) Diagonal mixed-mode failure, including the cracking of the masonry units combined with significant joint sliding under higher levels of vertical loads, e.g., as shown in Figure 9 (c) and Figure 9 (d). The collapse mechanisms predicted by the FDEM model align well with the observed failure modes, as depicted in Figure 9.
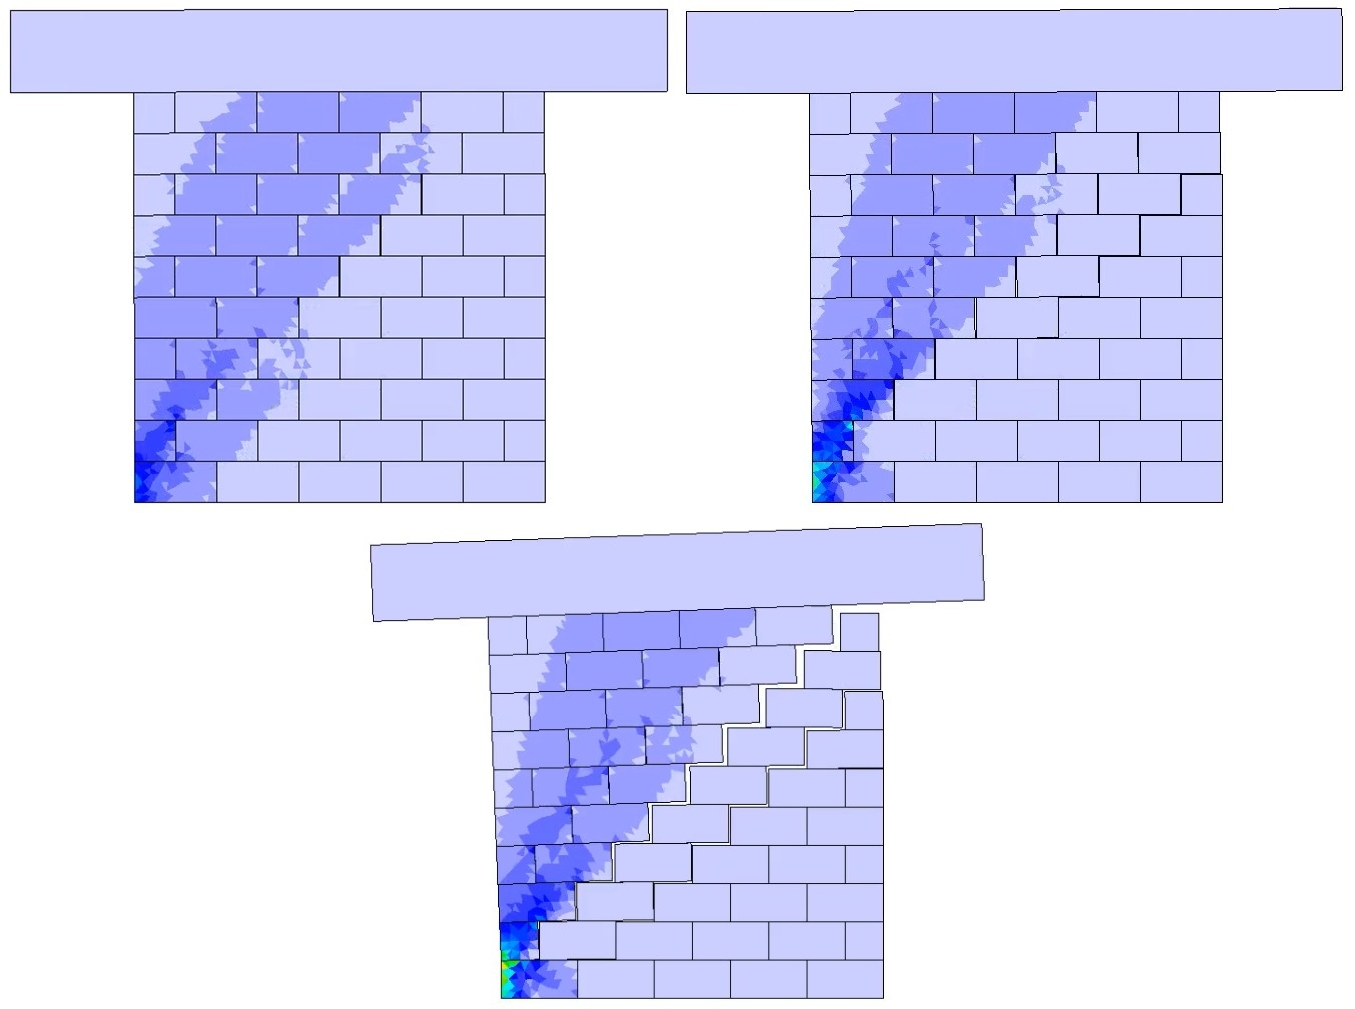
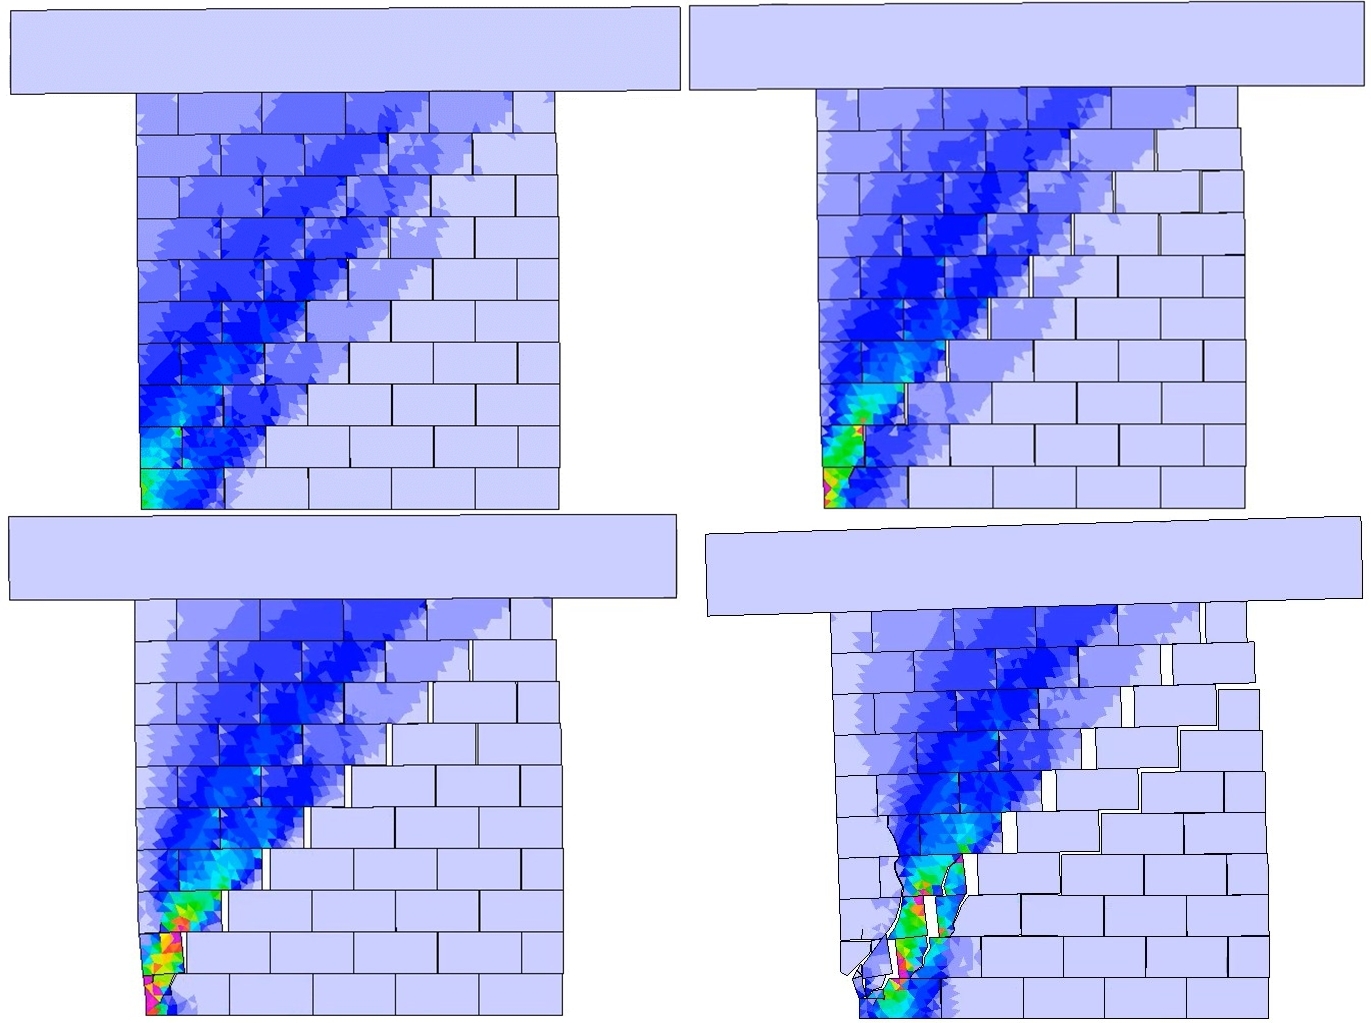
To further demonstrate the capability of the adopted FDEM approach, the force flow patterns were examined under two distinct failure modes: (i) rocking and (ii) a mixed mode of diagonal shear. In the case of rocking failure, the simulation successfully captures the redistribution of compressive forces toward the corners, Figure 10 (a), illustrating the joint openings, Figure 10 (b), and simulating the alternating contact points as lateral drift increases, Figure 10 (c). Conversely, for the diagonal mixed-mode failure, the numerical results capture the concentration of the compressive forces toward the corners, Figure 11 (a), initiation of the first crack, Figure 11 (b), redirection of compressive forces along the diagonal strut after cracking, Figure 11 (c), and ultimately crack propagation within the stone units. Figure 11 (d). The results highlight FDEM’s versatility in reproducing the underlying mechanics of various lateral load–induced failure mechanisms.
Discussion
Equivalent Energy Elastic-Plastic Curves
The concept of equivalent energy elastic-plastic (EEEP) bilinear curves, which traditionally serve to approximate complex structural behaviour in a simplified manner, is an important consideration for structures and materials undergoing inelastic deformations. Using the EEEP method, the nonlinear stress-strain behaviour of materials and structures under inelastic deformations can be simplified into an idealized bilinear force-displacement curve, while still capturing the essential features of the response. As the name equivalent energy implies, the bilinear curve is established by ensuring that the area under the bilinear curve is equal to the area under the actual nonlinear stress-strain or force-displacement curves.
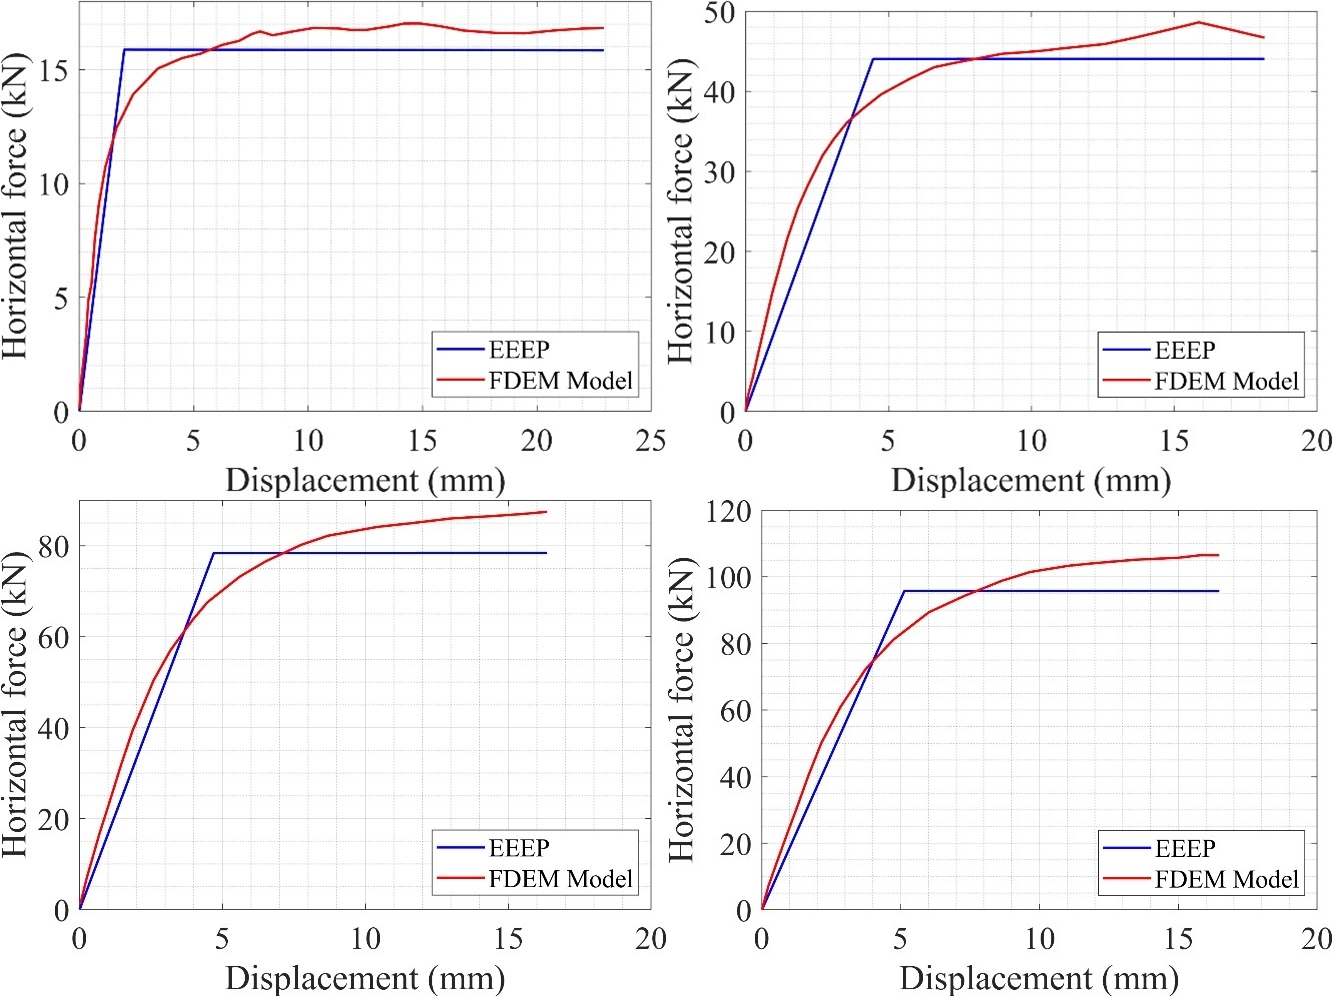
In this study, EEEP curves were developed and implemented, and the elastic stiffness values were determined as the initial slopes of the force-displacement response, obtained by linear regression up to 70% of the peak load [26]. The displacement values corresponding to the peak loads of each analysis were taken as the ultimate displacement values. Then, the EEEP curves were adjusted so that the total area beneath the curves matched the area under the nonlinear response, ensuring equivalent energy dissipation [27]. This approach is advantageous in finite element analysis and other numerical methods for simulating the behaviour of structures under extreme loading conditions, such as earthquakes or impact events [28-29]. The use of EEEP curves also enables the identification of key design parameters, such as the stiffness, yield point and ultimate strength, in a relatively simple yet accurate manner. The reason behind picking the ultimate displacement points with the highest capacities is because in DJ-SMWs, most of the structural strength and stability are lost after reaching peak capacity, which coincides with the end of the inelastic region [30]. The EEEP bilinear curves for the wall specimens tested by Lourenço et al. [8] are shown in Figure 12, along with the numerically predicted force-displacement curves. For the lower stress levels of 0.15 MPa and 0.5 MPa, as shown in Figure 12 (a) and Figure 12 (b), respectively, the EEEP curves provided an energy-equivalent idealization of the numerical simulations and show that the yield point and displacement capacity to be identified in a simplified manner. In these specimens, the walls can undergo relatively larger displacement capacities with lower lateral resistance levels. Additionally, as shown in Figure 12 (c) and Figure 12 (d), corresponding to the higher pre-compression levels, it can be seen that the EEEP curves can still represent the wall responses consistently. Also, these figures reflect the increase in lateral load capacity and the reduction in displacement demand associated with higher pre-compression levels.
By using these curves, the initial stiffness, equivalent yield point, displacement demand, ductility, and energy dissipation of the wall specimens can be assessed in a simplified and consistent manner.
Ductility Indices of the Walls
Different parameters, indices, and measures can be used to evaluate the structural performance of a building, such as those strains, deformations, load-carrying capacities, or stiffness softening [31]. The ductility index is used to assess the capacity of masonry structures under seismic events. The main comparison is between yielding deformation, also known as the point at which the initial stiffness is degraded, and the ultimate displacement point. Thus, the ductility index is defined as the ratio of the ultimate displacement point to the yield deformation point:
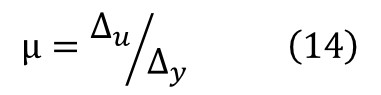
where μ is the ductility index, Δu is the ultimate or maximum displacement, and Δy is the yield or cracking displacement, obtained from the EEEP curves. A higher ductility index indicates greater deformation capacity and ductile behaviour, which is desirable for structures subjected to seismic loads. Compared to other construction types, mass masonry structures are considered to have comparably low and limited ductility due to the brittle nature of masonry materials. This measure can be used to assess the structure’s ability to withstand inelastic deformations without significant strength degradation under load. In summary, the ductility index is a quantitative measure that should be considered to assess the deformation capacity of masonry structures, particularly to ensure safety and adequate performance under seismic loading.
Using the calculated ductility indices of the FDEM models of the analyzed URM wall, the relationship between the ductility index and the applied vertical stress has been determined by fitting a curve to the numerical data. An additional analysis with a pre-compressive force of 50 kN was conducted to extend the range of validity of the regression analysis results. Consequently, a curve representing the 95% confidence bounds was fitted to the analysis results, as shown in Figure 13, through power law regression:

where a, b, c, and d are empirical curve-fitting parameters. In the current study, these were found to be equal to 18.809, -0.764, 0.491, and -0.074, respectively.
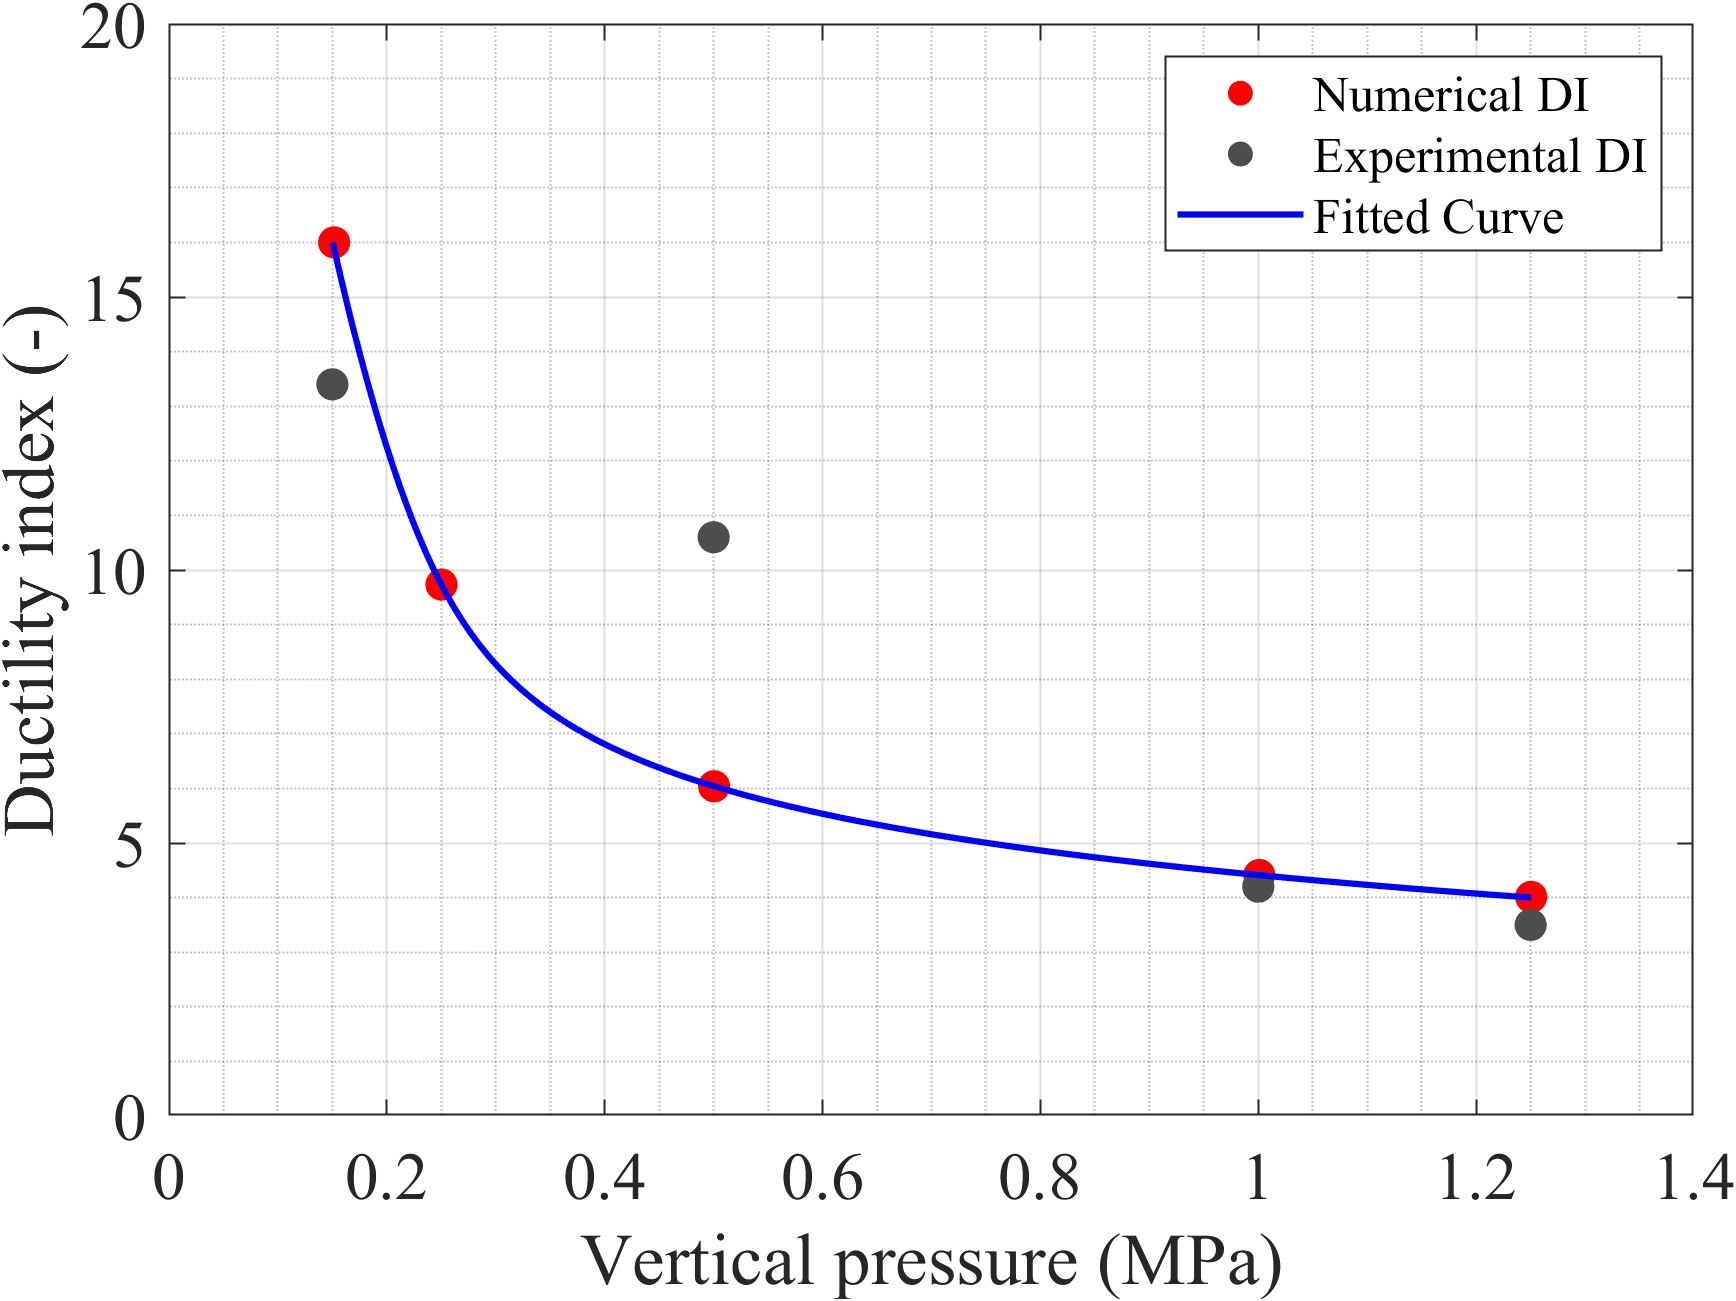
Equation 15, while valid only for the parameters investigated in prior studies, including wall geometry and level of axial loading, demonstrates an apparent relationship between axial loading and the anticipated in-plane ductility of DJ-SMWs. As shown in Figure 13, a disproportional relationship can be observed between the axial load level and the ductility index. This is likely explained by a shift in the overall failure mode, depending on the presence or absence of compressive stresses across the wall segments. While this formula cannot be generalized, it suggests an apparent correlation between axial load level and anticipated in-plane ductility; DJ-SMWs with high axial loads are expected to exhibit less ductility, thereby being more prone to brittle failures under in-plane loading. To ensure a better comparison, the ductility indices corresponding to the experiment results were calculated using the same approach. Consistent with the findings of the numerical analysis, the experimentally derived ductility indices were found to be decreasing with increasing axial loads, as shown in Figure 13, following the numerically observed trend. However, the wall specimens loaded to 0.5 MPa showed a noticeable deviation from the trend. This deviation in trend was caused by the lack of interlayer material induced stress concentrations in the contact points, which eventually led to premature vertical cracking of the stone units [8].
It is important to note that the range of vertical pressures considered in the current study closely matches the stress levels typically experienced by unreinforced masonry (URM) buildings. As such, the fitted curve presented in this study captures the ductility index values across a representative range of normal stress conditions for masonry construction. This correspondence ensures that the obtained ductility–stress relationship is not only valid in the context of numerical analysis but also directly relevant to the in-situ behaviour of URM buildings subjected to realistic service and seismic loading scenarios. However, further experimental work is required to refine and validate these expressions for design and code considerations.
Conclusion
The current study introduced a discontinuum-based numerical modelling strategy using the finite-discrete element method (FDEM) to evaluate the structural response of unreinforced dry-joint stone masonry walls (DJ-SMWs) under in-plane monotonic lateral loading. Based on the results, the following conclusions can be made:
- The employed computational method and modelling strategy captured the behaviour of DJ-SMWs with similar accuracy to other numerical modelling strategies. Moreover, the predicted force-displacement curves aligned well with experimental findings.
- The FDEM model effectively predicted the failure mechanism by precisely simulating crack initiation and propagation at different pre-compression load levels. The failure modes and patterns observed in experimental studies, including the development of diagonal tension cracks and localized failure of masonry units at the toe, aligned well with the modelling results. The generated discrete block medium provides numerous contact planes within the masonry units, offering realistic fracture patterns and macro-failure modes.
- Using the numerical results of the current study, an empirical relationship was developed using regression analysis that can be used to estimate the required vertical pressure by inputting the targeted ductility index. Using such an approach may provide a reasonable estimation of the walls’ capacity to withstand lateral displacement. Furthermore, the need for extensive experimental testing or high-fidelity modelling can be minimized. It is worth noting, however, that the expressions formulated in this study cannot yet be generalized, and further work is required to establish the effects of other parameters, including various aspect ratios and opening configurations.
This study has shown that the proposed FDEM based modelling framework can capture the force-displacement response of DJ-SMWs. In addition, the collapse mechanisms observed in the simulations are very similar to experimentally recorded failure mechanisms. This indicates that the proposed approach is capable of not only capturing the overall behaviour but also the localization of damage causing the failure. Authors recommend future studies to focus on computational cost of the method, and its efficiency relative to other methods, such as FEM and DEM.
Author Contributions
Berk Karakus: Formal analysis, Investigation, Methodology, Validation, Visualization, Writing – original draft. Andrea Lisjak: Funding acquisition, Methodology, Software, Writing – review and editing. Omid Mahabadi: Funding acquisition, Methodology, Software, Writing – review and editing. Christian Viau: Conceptualization, Investigation, Supervision, Validation, Writing – original draft, Writing – review & editing. Bora Pulatsu: Conceptualization, Formal analysis, Funding Acquisition, Investigation, Methodology, Project Administration, Resources, Supervision, Validation, Visualization, Writing – original draft, Writing – review & editing. All authors have read and agreed to the published version of the manuscript.
Conflict of Interest
At the time of the study, two of the authors were employees of Geomechanica Inc., who developed Irazu, the modelling software used in this study.
Funding
The authors would like to gratefully acknowledge funding provided by Mitacs and Geomechanica Inc.
Data availability statement
The supporting data is available on request from the corresponding author.
References